Cycling is a fun, sustainable and healthy way to explore, enjoy and commute in Fairfax County.
In the last 20 years, there’s been a significant increase in bicycling on county trails, sidewalks and roads. As a result, we’ve expanded our multi-use trails and bike lanes.
Be ready for your next ride with safety tips, our bike map, bike parking information and more.
CYCLING SAFETY FOR CYCLISTS AND DRIVERS
These safety guidelines from our Police Department help make the roads safer for cyclists and drivers alike; our Take a Moment campaign also provides safety tips.
For Cyclists:
- Wear bright clothing during the day and reflective gear at night and in rainy conditions. Ensure your bike is equipped with working lights and reflectors.
- Always wear a properly fitted helmet. It’s your best defense against serious head injuries. Use hand signals and obey all traffic laws. Check over your shoulder before turning or changing lanes and make eye contact with drivers to ensure they see you.
- Be mindful of your surroundings and anticipate potential hazards. Lookout for loose gravel, ice, sand, puddles, branches, broken glass and other road or trail hazards.
- Watch for turning vehicles, particularly from side streets and driveways, and ride outside the door zone of parked cars.
For Drivers:
- Slow down and avoid distractions while driving.
- Give cyclists at least three feet of space when passing. Be patient and wait for a safe opportunity to pass.
- Always scan blind spots for cyclists before making lane changes. Remember to check your mirrors and look over your shoulder. Be mindful of bike lanes and check for cyclists before turning right, as they may be riding alongside or approaching from behind.
- Cyclists do not travel as fast as cars. Exercise patience and avoid aggressive maneuvers around them.
BIKE TRAILS
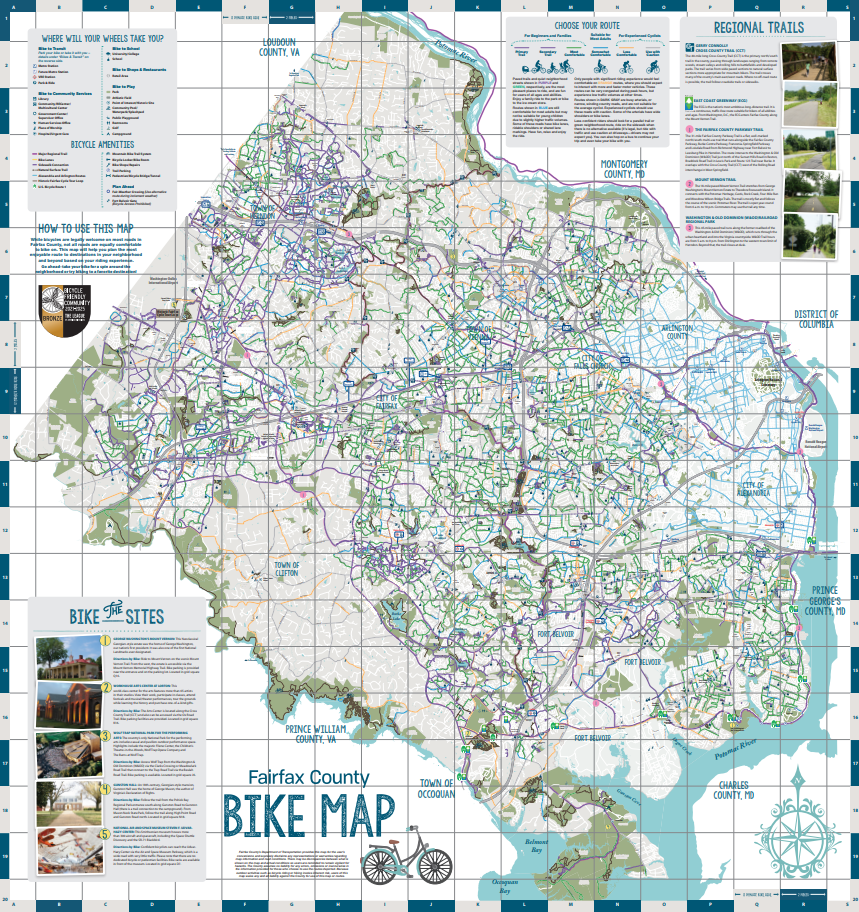
Whether you’re going for a spin around the neighborhood, biking to work or enjoying your local park, our interactive Bike Map can help you find the best route to your destination.
The map is color-coded to mark trail difficulty: 
- Purple and green: Paved trails and quiet neighborhood streets for a relaxing ride for beginners and families.
- Blue: Trails that are comfortable for most adults but may not be suitable for young children due to slightly higher traffic volumes
- Orange: Trails for experienced cyclists. Riders can expect to interact with more traffic.
- Dark gray: Busy arterials or narrow, winding roads that are not suitable for the average cyclist. Experienced cyclists should use these roads with caution.
Our Park Authority offers additional trails in our parks. See Park Authority trails.
COMMUTING BY BIKE
Hundreds of county residents commute by bike every day. Find tips and resources for your next ride to work.
STORING YOUR BIKE
Fairfax Connector Bike Racks
All Fairfax Connector buses have bike racks mounted on the front. Each bus can carry two bicycles at no additional charge to the passenger.
When using a Fairfax Connector bike rack, ensure the driver sees you and has stopped before stepping out in front of the bus.
Do not leave anything on the bike that might blow off in the wind or fall off when the bus is moving.
All Metro buses are equipped with bicycle racks similar to those mounted on Fairfax Connector buses. There is no additional cost and there are no restrictions. Find more information here.
Bike Parking
We have four secure bicycle rooms to park and store your bike.
- Stringfellow Park and Ride – 4920 Stringfellow Road, Centreville
- Wiehle-Reston East Metrorail Station – 11389 Reston Station Boulevard, Reston
- Herndon Metrorail Station – 12530 Sunrise Valley Drive, Herndon
- Innovation Center Metrorail Station – 13747 Sunrise Valley Drive, Herndon
Access to these rooms is controlled electronically and only members have access. Membership is $60 per year and includes 24/7 access to all secure bicycle rooms.
Bike Lockers
Bike lockers provide a way to store your bicycle securely out of the elements of rain, sun and snow. They are usually located at transit transfer centers such as park-and-ride facilities.
Our Department of Transportation manages bicycle lockers at the following locations:
- Herndon Metrorail Station
- Reston South Park and Ride
- Reston Town Center Transit Station
- Spring Hill Metro Station Kiss and Ride
- Burke Centre VRE Station
- Backlick Road VRE Station
WMATA provides lockers at most Metrorail stations. You can get additional information about these lockers by calling the WMATA Bicycle Information Line 24 hours a day at 202-962-1116.
VDOT leases lockers at state-owned/maintained park-and-ride lots. For Information and availability, contact VDOT’s Bicycle and Pedestrian Program Coordinator at 703-383-2233.
BIKESHARE
We currently have more than 70 Capital Bikeshare stations in Merrifield, Reston and Tysons, and we’re working on adding approximately 40 more stations to the system.
New e-bike features:
- No shift transmission
- Electric assist up to 20 mph
- Stronger basket
- Retroreflective paint improves visibility
- Larger battery
- More durable seat clamp


